
Chapter 55: Ischemia
Imaging Strategies
The evolution of imaging has helped in understanding and correlating the clinical experience with classical experimental models of cerebral infarction and has actually provided tools that can advance the experimental methodology itself. This is particularly true of the latest MRI developments, such as MR spectroscopy (see Chapter 72) and diffusion imaging (see Chapter 7 and Chapter 68), which are only briefly discussed in this section.
The early water accumulation in the ischemic brain can be depicted both with computed tomography (CT) and MR techniques. However, MRI is more sensitive than CT to subtle increases in bulk water, thus demonstrating regions of infarction within the first few hours more reliably than CT scans (Figure 55-3 and Figure 55-4).29,112 Experimental models of cerebral occlusion show that ischemic changes caused by stroke can be detected on MRI within the first few hours of the ictus.24,122 In patients with the clinical diagnosis of acute infarction, 82% of MR scans depict the abnormality within 24 hours of the ictus, as compared with 58% of the CT scans.29 Additionally, MRI better defines the extent of infarction.29 Nevertheless, standard MRI sequences may fail to depict acute stroke in 10% to 20% of patients.2
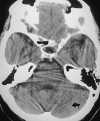 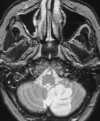 |
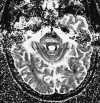
| Figure 55-3 A 68-year-old woman with dizziness and vomiting. A, CT scan at the level of the posterior fossa was read as negative. Even in retrospect, a very subtle area of low attenuation (arrow) involving the inferior aspect of the left cerebellar hemisphere is difficult to identify with certainty because of extensive streak artifact. B, Corresponding T2-weighted axial image obtained within 24 hours shows an obvious left PICA territorial infarction. |
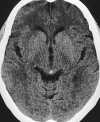 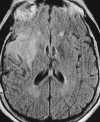  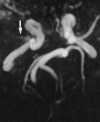 |
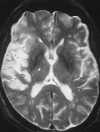
| Figure 55-4 A 71-year-old woman with atrial fibrillation and 4-hour onset of left-sided hemiparesis. A, CT axial image shows no discernible abnormality within the right MCA distribution. B, Turbo FLAIR axial image obtained 5 hours later clearly shows a right MCA territorial infarction despite motion artifact. C, On the corresponding T2-weighted axial image the extent of infarction is obscured because of partial voluming with the adjacent CSF. D, 3D TOF MRA obtained at same sitting shows proximal occlusion of the right MCA(arrow), presumably the result of embolus. |
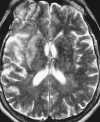
With standard spin-echo sequences, the earliest finding of ischemia, which is present within minutes of onset, is loss of normal vascular flow void phenomena (Figure 55-5).135 Morphological changes in brain parenchyma caused by tissue swelling can be seen on T1-weighted images as early as 2 hours after the ictus.135 However, conventional T2-weighted sequences are not reliably sensitive in detecting ischemia in the first few hours after onset. The development of signal change on T2-weighted images is thought to be caused by the early increase of approximately 3% in overall brain water content with acute ischemia. Recent data suggest that fluid attenuated inversion recovery (FLAIR) images are more sensitive than proton density– and T2-weighted images to subtle increases in bulk water seen in the setting of acute cerebral infarction (Figure 55-6).21,38,39,56,107 FLAIR and its fast or turbo spin-echo variants produce a heavily T2-weighted image with suppressed cerebrospinal fluid (CSF) signal. To accomplish these two goals in a time frame amenable to routine scanning, a fast or turbo spin-echo sequence is prefaced by a 180-degree inversion pulse, with an inversion time (TI) required to null CSF of 2000 to 2600 msec (see Chapter 5). In addition to providing increased conspicuity of infarction when compared with conventional T2-weighted images, FLAIR sequences are better able to detect areas of T2 prolongation at the brain-CSF interfaces. At these sites, signal alteration can easily be hidden because of partial volume artifact with CSF on conventional T2-weighted images (Figure 55-7).
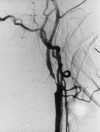   |
| Figure 55-5 A 65-year-old woman with sudden onset of left-sided hemiplegia. A, Lateral view of right carotid arteriogram shows preocclusive disease. B, T2-weighted axial image shows diffuse high signal abnormality throughout the right MCA distribution at the level of the third ventricle. Also note the punctate hyperintensity within the posterior limb of the right internal capsule. C, T1-weighted axial image at the skull base shows flow-related enhancement in the right ICA resulting from slow velocity secondary to the preocclusive lesion in the neck. Note normal flow void of high-velocity signal loss in the basilar and left cavernous carotid artery segments. |
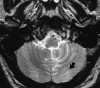 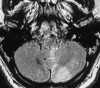 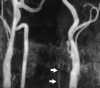 |
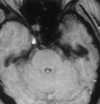
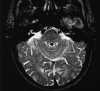
| Figure 55-6 A 48-year-old man with acute onset of dizziness and ataxia. A and B, T2-weighted and turbo FLAIR axial images show acute infarction involving the PICA distribution of the left cerebellar hemisphere, which is quite subtle on the T2-weighted image as compared with the FLAIR image. C, 2D TOF MRA performed at the same sitting shows a stringlike left vertebral artery that most likely represents dissection. Although a conventional intraarterial angiogram was not performed, subsequent MRA (not shown) showed marked improvement of the left vertebral artery flow signal. |
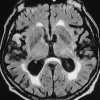 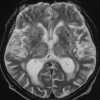 |
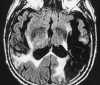
| Figure 55-7 A 77-year-old man with 10-hour onset of aphasia. A, Turbo FLAIR axial image shows an area of gyral infarction involving the right temporal lobe (arrow). B, On the corresponding T2-weighted axial image it is difficult to distinguish the area of infarction from partial voluming of the CSF. Also note the predominantly confluent periventricular deep white matter signal alteration, which is most likely the result of ischemic change. |
The use of gadopentetate dimeglumine can improve the sensitivity of MRI in the detection of early cerebral ischemia.44,135 Arterial enhancement is the earliest finding and can be detected within minutes after onset of ischemic symptoms (Figure 55-8). Slow antegrade or retrograde (collateral) flow is thought to be the likely mechanism for arterial enhancement seen with early cerebral ischemia.95,109 The enhancement of such vessels indicates slow flow and a potentially reversible decrease in regional perfusion but may presage the ultimate development of infarction. Meningeal enhancement caused by leptomeningeal collaterals can be seen with large cerebral artery territorial infarcts. However, this enhancement occurs later than vascular enhancement, with a peak occurrence at 1 to 3 days.135 The intravascular enhancement sign and meningeal enhancement are generally no longer present beyond 1 week after the ictus. In general, parenchymal enhancement is a subacute finding that can be seen as early as 2 days after ictus but is most commonly seen after the first 6 days. Early or intense parenchymal enhancement seen within the first 3 days is usually associated with minimal or reversible neurological sequelae. Such early enhancement is thought to be related to incomplete isch-emic allowing a significant amount of contrast material to reach the ischemic tissue via collateral or antegrade flow.37 This early parenchymal enhancement pattern has an inverse relationship with the area of signal change on T2-weighted images, again suggesting a less severe ischemic insult. In contrast, progressive parenchymal enhancement seen in the subacute stages most likely reflects vascular bed damage (and thus disrupted BBB) and has a direct relationship with the degree of signal abnormality seen on the T2-weighted images. The absence of early enhancement in this setting is thought to be the result of complete ischemia with significant interruption of blood flow and hence contrast delivery to the ischemic tissue.37,127 The progressive parenchymal enhancement pattern is usually most intense in the subacute phase (7 to 30 days) and gradually fades in the chronic phase (more than 30 days).37
 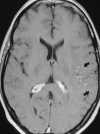 |
| Figure 55-8 A 43-year-old woman with a 4-hour history of fluctuating aphasia and right-sided hemiparesis. A, No detectable abnormality is present on the T2-weighted axial image, which was degraded by patient motion. B, Corresponding contrast-enhanced T1-weighted image shows arterial enhancement in the left MCA distribution (arrows). Arterial enhancement is thought to represent slow antegrade or retrograde (collateral) flow. Two days later a second MRI was obtained (not shown) that clearly demonstrated the area of infarction. |
Mass effect is most evident as edema builds over the first 3 to 7 days and stabilizes during the second week. During the second postictal week, the abnormally hyperintense region of cerebral infarction seen on the T2-weighted images occasionally may regress or even disappear. This phenomenon has been referred to as MR fogging.5 The proposed mechanism for the T2-shortening is thought to be the result of diapedesis of the red blood cells into the edematous tissue, which can cause a relative decrease in signal intensity on T2-weighted images in both the cortical gray matter and subcortical white matter. This hypothesis is supported by the observation that intense contrast enhancement can be seen in the affected area at the time that the fogging effect occurs. Occasionally, then, only contrast-enhanced sequences show such foci of fogged subacute infarction.
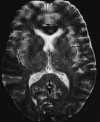
By the third week, the mass effect and edema subside, and the atrophic process, including tissue loss and variable gliosis, begins with enlargement of the adjacent sulci and ventricles. Microscopically, gliosis is seen as reactive astrocytes, enlargement of the extracellular space, reduced cellularity, and white matter demyelination. Well-delineated foci of CSF signal intensity or macrocystic encephalomalacia17 may occur (Figure 55-9).
 |
| Figure 55-9 A 79-year-old man with possible recent stroke. Fast FLAIR axial image shows extensive macrocystic encephalomalacia involving the left MCA territory as a result of remote infarction. In addition, there is an area of wedge-shaped subacute infarction involving the right temporal lobe (arrow). These findings are superimposed on a diffuse atrophy and periventricular deep white matter ischemic change. |
Magnetic Resonance Angiography
MRA is a major advance in ischemic imaging techniques and is now obtained routinely with conventional MR studies of the brain. A brief discussion on both extracranial and intracranial MRA follows. (See Chapter 56 for further discussion.)
The sensitivity and specificity of two-dimensional time-of-flight (2D TOF) MRA for detecting flow limiting lesions in the common carotid bifurcation and cervical carotid artery approximates 90%.7 However, 2D TOF MRA tends to overestimate the degree of stenosis at the carotid bifurcation. In addition, care should be taken when diagnosing complete vessel occlusion on MRA. This error can be avoided by reviewing the 2D TOF source images and by acquiring 3D TOF images, which are less sensitive to turbulent flow artifact.3,4,40 Most importantly, MRA techniques have a high negative predictive value. Thus a normal or near-normal MRA of the carotid arteries can effectively exclude the possibility of a high-grade carotid stenosis.15
The anatomy of the circle of Willis, as well as its fast arterial flow, lends itself well to both 3D TOF and 2D or 3D phase-contrast (PC) MRA in the evaluation of cerebrovascular ischemic disease. Heiserman and coworkers61 studied patients with focal neurological deficits using 3D TOF techniques and found that nearly all normal (97%) and occluded (100%) vessels were correctly identified. Stenosis, however, was incorrectly graded in more than 40% of the patients, primarily as a result of artifactual focal signal loss caused by turbulence mimicking stenosis. By using judiciously placed presaturation pulses during a 2D or 3D TOF acquisition at the circle of Willis, the pattern of collateral blood flow can be determined by the pattern of signal loss.42 PC MRA can show the direction of flow in each of the contributing arteries of the circle of Willis.15 Recently, both TOF and PC MRA have been applied on a quantitative basis to measure flow in the MCA.15,85
Spectroscopy
Any nucleus with a nonzero nuclear spin has the ability to generate an MR signal; thus metabolic derangements induced by ischemia can be depicted with MR spectroscopy (MRS).10,11,83 MRS is currently the only noninvasive method for measuring millimolar concentrations of cerebral metabolites, such as lactate, amino and fatty acids, phosphorus metabolites, and other metabolically relevant compounds, such as neurotransmitters.10,83 MRS studies of cerebral ischemia have been confined primarily to proton (1H) and phosphorus (31P) nuclei because of their natural abundance. 31P MRS can detect subtle frequency differences between various phosphate nuclei. Thus ATP resonances can be distinguished from other phosphate-containing molecules, such as inorganic phosphates, phosphocreatine, and phosphodiesters. Immediately after an acute ischemic insult, there is progressive loss of high-energy intracellular ATP and phosphocreatine (PCr), with resultant decreases in the phosphocreatine/inorganic phosphate (PCr/Pi) ratio. 31P MRS can detect these alterations within minutes after the onset of ischemia, whereas the signal alteration on T2-weighted images is not observed until 11/2 to 3 hours after arterial occlusion.10,92
High-resolution 1H MRS is expected to improve our understanding of the metabolic alterations that accompany ischemia, particularly those related to acid-base balance. 1H MRS can depict an increase in lactate concentration and concomitant decrease in intracellular pH in the hyperacute ischemic stage when conventional MRI signal abnormalities are minimal. N-Acetylaspartate (NAA) is thought to be located solely in neuronal bodies and has been shown to be either depleted or completely absent from infarcted tissue on MRS.11,83 Thus it is speculated that areas of the brain that have elevated lactate concentrations but also exhibit normal levels of NAA may represent ischemic tissue that is potentially salvageable. However, aside from the experimental context, current MRS methodology holds little role in the clinical management of stroke given the associated medical and logistical problems in the patient with acute ischemia.
Diffusion Imaging
Recent experimental models have shown an increased sensitivity of diffusion-weighted images over conventional T2-weighted images in the detection of early cerebral ischemia (Figure 55-10).75,89,93 First described by LeBihan,77 diffusion imaging is sensitive to the microscopic motion of water protons. Protons in moving water molecules undergo a phase shift of their transverse magnetization in the presence of a magnetic field gradient. Thus areas of greater diffusion (fast) are subject to a greater degree of signal attenuation compared with areas of diminished diffusion (slow), which have less signal attenuation. A diffusion-weighted image can be obtained by incorporating strong diffusion sensitizing gradients into a conventional spin-echo sequence. The resulting image reflects signal alteration caused by water proton diffusion and T1 and T2 relaxation effects. Increasing the duration and amplitude of the gradients increases the sensitivity of MRI to the molecular diffusion of water. The apparent water diffusion coefficients (ADC) can be calculated by acquiring two or more images with a different gradient duration and amplitude. In feline MCA occlusion models, ADCs of 0.8 ± 0.1 ´ 10-5 cm2/s were measured in both the normal basal ganglia and cortical gray matter. The corresponding ADC measurements from ischemic regions, measured as early as 45 min after MCA occlusion, were significantly lower at 0.3 to 0.6 ´ 10-5 cm2/s, presumably reflecting restriction of water motion by the cell membrane.94 It also has been shown that a diminished ADC in ischemic brains can be reversed after early reperfusion.89,94 The increased sensitivity of diffusion-weighted MRI in detecting acute ischemia is thought to be the result of the water shift intracellularly restricting motion of water protons (cytotoxic edema), whereas the conventional T2-weighted images show signal alteration mostly as a result of vasogenic edema. The exact origin of the lower ADC measurements seen with early ischemia, however, has not been fully established. The diminished ADC value also could be the result of decreased temperature in the nonperfused tissues, loss of brain pulsations leading to a decrease in apparent proton motion, increased tissue osmolality associated with ischemia, or a combination of these factors.10,31,77 Regardless of the cause, a lower apparent ADC is a very sensitive indicator of early ischemic brain at a stage when ischemic tissue remains potentially salvageable.131
 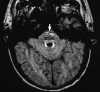  |
| Figure 55-10 An 85-year-old man with left gaze diplopia and unsteady gait for 8 hours. A, T2-weighted axial image shows no areas of elevated signal within the pons. B, Corresponding diffusion-weighted image shows multiple hyperintense foci of ischemia within the pons (arrow). On this diffusion-weighted image, fast-moving protons, such as those in blood and CSF, become hypointense, whereas slow-diffusing protons appear hyperintense. C, On the apparent diffusion coefficient (ADC) image, two diffusion-weighted images of different b values are obtained to remove both the T1 and T2 effects, resulting in a pure- diffusion image. On this image, hyperintensity denotes fast apparent diffusion, restricted areas of diffusion become hypointense, and thus the ischemic foci within the pons (arrow) now appear hypointense. (Courtesy M.E. Moseley, Department of Radiology, Stanford University.) |
Perfusion Imaging
The observed signal alteration seen on MR perfusion images obtained after intravenous contrast injection differs fundamentally from those seen on conventional enhanced MR images. MR perfusion studies use paramagnetic or superparamagnetic susceptibility contrast agents, such as gadolinium or dysprosium chelates, or iron oxide particulates. These agents induce signal alteration in regions of the brain where they are delivered. The intravascular compartmentalization of these agents results in magnetic susceptibility-induced T2* shortening. Unlike conventional enhanced MR images (where the T1-shortening effect is the result of short-range, dipole-dipole interactions), on perfusion images the T2-susceptibility effect is long-range, extending well beyond the vessel lumen and into the adjacent brain tissues. Thus ischemic areas appear relatively hyperintense compared with the signal loss of normally perfused brain.
T2*-shortening contrast agents can be administered during acquisition of gradient-echo T2*-weighted sequences, delineating regions of perfusion deficit (i.e., perfusion-weighted imaging). However, ultrafast MR techniques, like echo-planar imaging, allow visualization of the signal intensity changes during the initial vascular transit of the contrast bolus. Thus perfusion MRI depicts the passage of contrast through the cerebral microcirculation.94 In addition, dynamic, ultrafast perfusion MRI can provide at least semiquantitative analysis of cerebral perfusion. By using contrast concentration-time curves, the regional cerebral blood volume (rCBV) and regional cerebral blood flow (rCBF) can be calculated. Initially, dynamic susceptibility contrast-enhanced imaging techniques were used to estimate relative values of rCBV.41,55 Recently, preliminary data show that quantitative measurements of the rCBF and rCBV can be calculated as well, thus providing a basis for follow-up studies or comparative investigations.103 However, limitations such as spatial resolution and low signal-to-noise must be overcome before application in the clinical situation.10,105 It is quite reasonable to assume that a patient with the acute onset of ischemia, a positive perfusion scan, and a negative diffusion scan may be manifesting reversibly injured ischemic brain.
~Previous ~ Next ~
~ Back to Chapter Index ~
~ Back to Magnetic Resonance Imaging main page ~